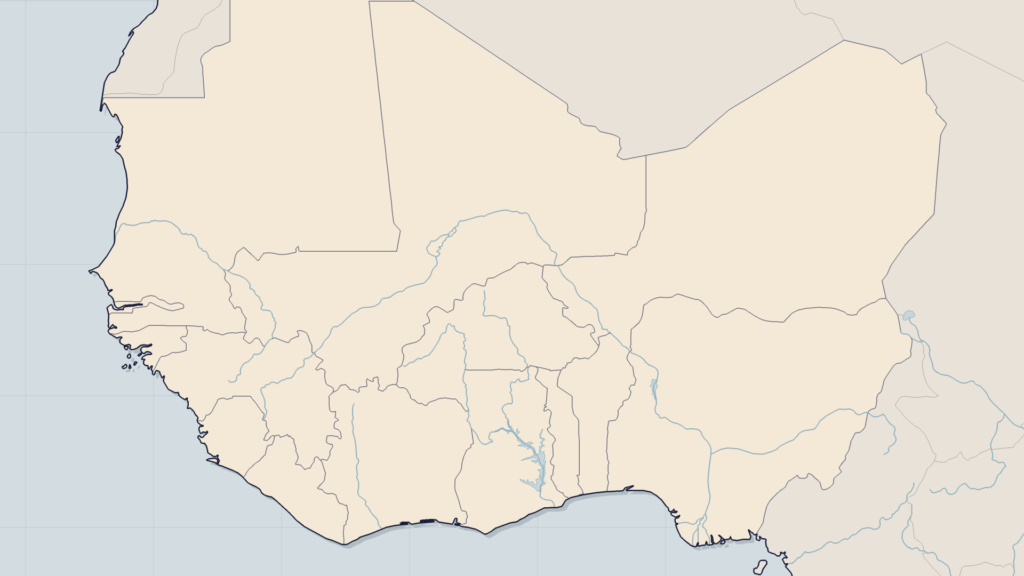
Looking for a security risk map of West Africa today means running into a patchwork: consular travel advice maps, incident maps produced by event databases, think-tank reports, media representations. Each follows its own logic, and none is sufficient on its own to base a decision on establishment, travel or business continuity. This article offers two things: a method for reading these maps — what they show, what they leave out — and a zone-by-zone reading of regional security risk, dated June 2026, from the central Sahel to the Gulf of Guinea.
How to read a security risk map
The coloured zones of travel advice
The most consulted maps are those of Western foreign ministries, foremost among them France Diplomatie travel advice. Their code is simple: red (formally advised against), orange (advised against except for compelling reasons), yellow (heightened vigilance), green (normal vigilance). Their strength is readability; their limits are well known. The grid is coarse — an entire region switches from one colour to another —, updates come in fits and starts, and the logic is consular: it protects nationals, it does not assess the specific risk of a mining operation, a logistics convoy or a humanitarian programme.
Incident maps and event data
The second family: maps built on geolocated event data, such as those based on ACLED, which records attacks, clashes and violence against civilians. They offer the granularity that consular maps lack: the incident is dated, located and categorised. But an incident is not a risk. An area without a recent attack is not a safe area — it may be under the control of an armed group that no longer needs to fight there; a heavily documented area may simply be better covered by sources. Added to this are collection delays and chronic under-reporting in the most isolated areas.
A professional reading therefore cross-references both families, adds the trend (the direction the threat is taking matters more than its snapshot) and goes down to the useful level: the road, the corridor, the radius around a site. That is the reading offered in the rest of this article.
Central Sahel: the epicentre (Mali, Burkina Faso, Niger)
On every map, the red core is the same: the central Sahel. Burkina Faso remains the most affected country — almost all consular maps classify it as red outside Ouagadougou and Bobo-Dioulasso, and several provinces live under a de facto blockade, almost cut off from the rest of the country. In Mali, the coordinated attacks of 25 and 26 April 2026 on Mopti, Gao, Kidal, Sévaré and approach routes to Bamako showed a change of scale, while the blockades on the capital’s supply routes — including the fuel episode at the end of 2025 — are a reminder that the threat now weighs on flows as much as on positions. In Niger, the Tillabéri region concentrates most of the violence, and Niamey’s response in Tillabéri illustrates the dilemmas of all the states in the area. The underlying question remains that of the real capacity of Sahelian armies to hold such a vast territory.
Liptako-Gourma, the heart of the arc of instability
At the junction of the three borders, Liptako-Gourma remains the area with the highest density of incidents in the entire region — it is the arena of competition between JNIM and the Islamic State in the Sahel, whose rivalry shapes the geography of the threat in Mali and beyond. Our analysis of the security dynamics of Liptako-Gourma details why this area functions as the epicentre from which the threat spreads southwards.
Coastal countries: the northern front under pressure (Benin, Togo, Ghana, Côte d’Ivoire)
The 2026 map no longer stops at the borders of the central Sahel: the northern strips of the coastal countries have become red or orange zones in their own right. In Benin, the border areas with Burkina Faso and Niger, the W and Pendjari national parks and several northern communes (Banikoara, Tanguiéta, Natitingou, Boukoumbé, Kouandé) are formally advised against by foreign ministries, against a backdrop of a proven kidnapping risk; the Kourou Koualou attack at the end of May 2026 confirmed the pressure. We have analysed in detail why attacks are increasing in northern Benin. In Togo, the Savanes region is under continuous pressure from Burkinabè territory. Northern Ghana and the border areas of Côte d’Ivoire remain classified as heightened vigilance: few attacks, but documented exposure to transit, recruitment and war-economy dynamics.
The scenario that all maps attempt to capture is that of a jihadist corridor towards the Gulf of Guinea, documented in particular by the International Crisis Group. For economic operators, the stakes are read in terms of flows: the regional trade corridors linking the Gulf ports to the Sahelian capitals pass precisely through the areas whose colour is deteriorating.
Nigeria and the Lake Chad basin: a long-standing risk in multiple forms
In the east of the region, the Nigerian map superimposes several risks of different kinds: jihadist insurgency (Boko Haram and ISWAP) in the north-east and the Lake Chad basin, armed banditry and mass kidnappings in the north-west, separatist tensions in the south-east — an accumulation we examined in our analysis of Nigeria’s capacity to contain these threats simultaneously. Added to this is the oil question: the Niger Delta remains an area of specific risk, where the threat targets installations and staff more than territory. Reading the map of Nigeria therefore requires distinguishing colours by type of risk, not only by intensity.
Atlantic seaboard: Senegal, Mauritania, Guinea — vigilance without alarmism
An honest reading of a risk map also includes the areas that are holding firm. Mauritania has not experienced a major jihadist attack since 2011 — an often-studied regional counter-example. Senegal remains largely green and yellow, even though Dakar is monitoring the Fouta and the south-east, which are exposed by their proximity to Mali. Guinea, for its part, combines political fragility and pockets of instability, notably in Forest Guinea. These nuances matter: a map that paints West Africa a uniform red is as misleading as a reassuring map — and leads to poor decisions on establishment as well as insurance.
From static map to operational decision
For a security manager, an NGO or an analyst, the map is not an end in itself: it is the entry point to a decision-making process. Three concrete uses emerge:
- Map your own exposure. Cross-reference the regional map with your sites, logistics routes and areas of operation, at the level of the route and the radius — not the country. Consular levels serve as a contractual and insurance reference; incident data serves operational management.
- Feed preparedness arrangements. An area that changes colour must trigger action: updating the evacuation plan, reviewing kidnapping risk prevention measures, adjusting travel and protocols for exposed staff.
- Follow the trend, not the snapshot. A risk map ages within a few weeks. The threat moves — which is the whole purpose of our monthly geopolitical, economic and security overview, which updates this reading as regional developments unfold.
FAQ — West Africa risk map
Which countries are most at risk in West Africa in 2026?
Burkina Faso, Mali and Niger account for most incidents and red zones, with Liptako-Gourma as the epicentre. They are followed by the northern border strips of Benin, Togo, Ghana and Côte d’Ivoire, as well as several states in northern Nigeria and the Lake Chad basin.
What do the red and orange zones on travel maps mean?
On consular maps (France Diplomatie and equivalents), red means “formally advised against” and orange “advised against except for compelling reasons”. These levels protect travellers; they do not measure the specific risk of a professional operation, which requires analysis at the level of the route or the site.
Are Benin and Togo safe in 2026?
The south of both countries remains classified as normal or heightened vigilance. However, their northern fringes — borders with Burkina Faso and Niger, the W and Pendjari parks, the Savanes region — are advised against, with recurring attacks documented in 2025-2026.
Where can an up-to-date security risk map be found?
By cross-referencing three sources: official travel advice (consular reference), geolocated incident databases such as ACLED (granularity), and regional analytical monitoring that interprets the trend. This continuously updated cross-referencing is precisely what the Sahel Watch platform offers.
Conclusion
The 2026 security risk map of West Africa tells the story of a geography in motion: a Sahelian epicentre that is becoming denser, coastal countries whose north is changing colour, a Nigeria with superimposed risks and an Atlantic seaboard that is holding firm. No static map keeps pace with this movement for long. Good practice is not to look for the perfect map, but to organise the cross-referencing of sources and the continuous updating of one’s own reading of risk.
That is precisely what Sahel Watch is: a living map of risk in West Africa, continuously fed by the monitoring of incidents, actors and regional dynamics. Book a demo to visualise, zone by zone and route by route, the risk that concerns your teams and your operations.